
Even though crude oil has had a powerful rally from the March low at $6.50 to its recent high of $49.43, it is still $13 per barrel below where it started the year at $62.82. The energy stocks have also performed very well as we end the year, but what is the outlook for 2021?
There are several ways to gather data to answer this question. One is to use the yearly pivot levels. For 2020 the yearly pivot was $59.55 and crude oil dropped below this level in the second week of January and stayed below it all year.
Crude Oil Weekly
TOM ASPRAY – VIPERREPORT.COM
Based on Tuesday’s close of $47.11 and a yearly range of $63.80 to $6.50, the tentative 2021 yearly pivot for crude oil will likely be around $39.07, with the first resistance (R1) near $71.63 and first support (S1) near $14.33. These numbers may seem well out of reach, but a lot can happen throughout the year. In 2020, the second level of yearly support (S2) for the S&P 500 was 222.72. The S&P 500 made it down to 219.10 in March, and the yearly high of 3722 on December 18 is not far below the second resistance level (R2) at 3739.
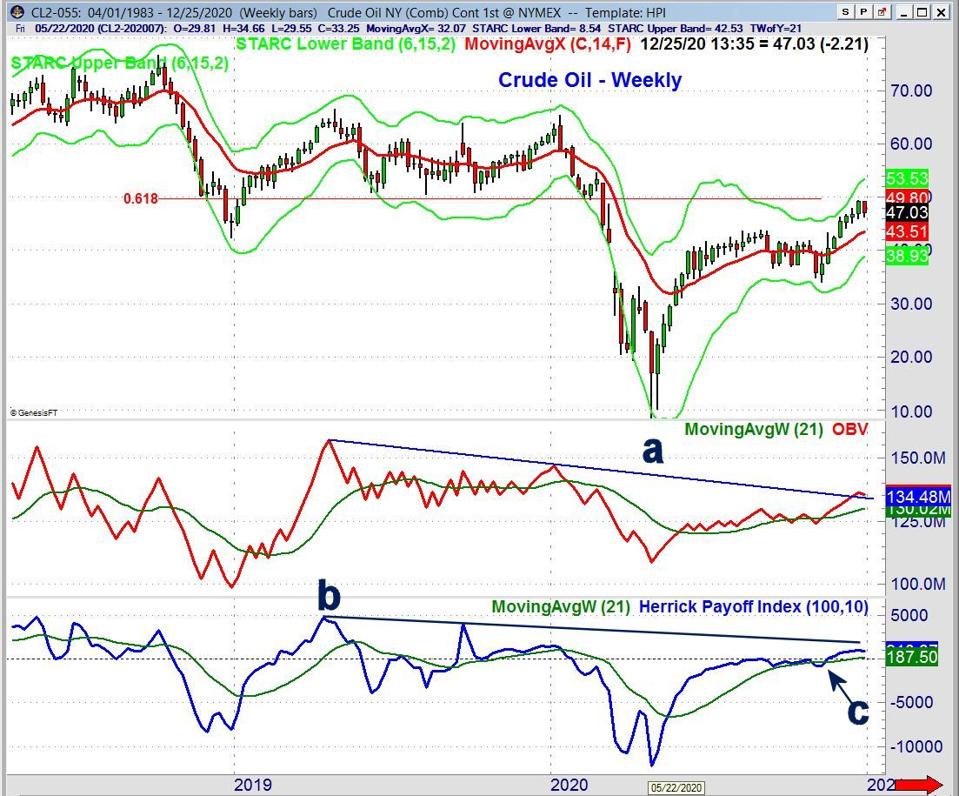
It seems very likely that we will start 2021 above the pivot at $39.01, but a weekly or monthly close below this level will be negative for crude oil’s trend in 2021.This weekly chart of the crude oil futures goes back to 2018. From the October 2018 high at $76.72 to the March 2020 low at $6.50, one can calculate the various Fibonacci levels of resistance. The 38.2% retracement resistance at $33.17 was overcome in late May, while the 50% resistance level $41.49 was overcome in the middle of August.
The remaining 61.8% resistance level stands at $49.80 and the December high so far has been $49.43. The weekly technical studies are positive. The on-balance-volume (OBV) is holding above its weighted moving average (WMA) and broke through its downtrend (line a) just a few weeks ago. The rising 20-day exponential moving average (EMA) at $43.49 should provide good support.
The Herrick Payoff Index (HPI) uses volume, price, and open interest to gauge whether money is moving in or out of a commodity. The HPI dropped below the zero line on January 24, 2020, and plunged until the end of March. The HPI moved above the zero line on November 13 (point c) and it will be important that it stays positive on a further correction. The HPI is still in a longer-term downtrend (line b).
Crude Oil – Daily
TOM ASPRAY – VIPERREPORT.COM
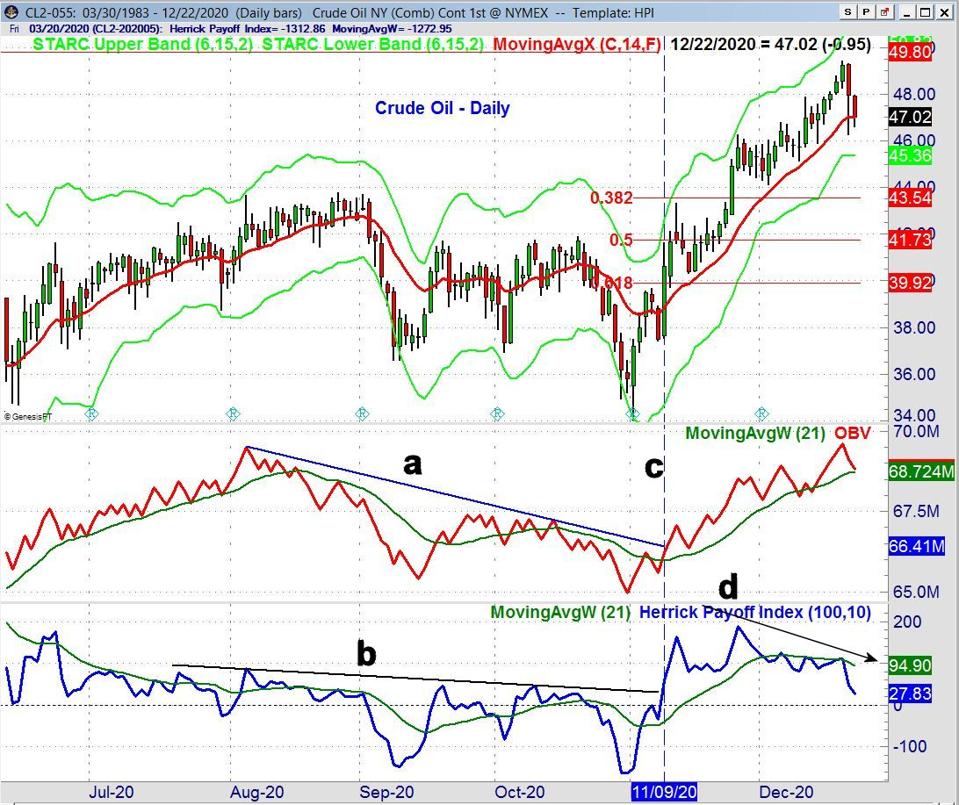
The daily chart shows that crude oil has dropped 5% from last Friday’s high, testing the still-rising 20-day EMA. A decline below the early December low at $44.10 is likely to confirm that a near-term top is in place. Based on the rally from November 2 until December 18, the 38.2% Fibonacci retracement support is at $43.54, with the 50% level at $41.73.
The OBV broke its downtrend (line a) on November 9 and moved sharply above its WMA. The daily HPI overcame its resistance (line b) at the same time and moved sharply above the zero line. The daily HPI now looks more negative, having diverged from prices in December (line d) by forming lower highs while crude oil prices were rising. The daily HPI is still above the zero line for now.
XLE
TOM ASPRAY – VIPERREPORT.COM
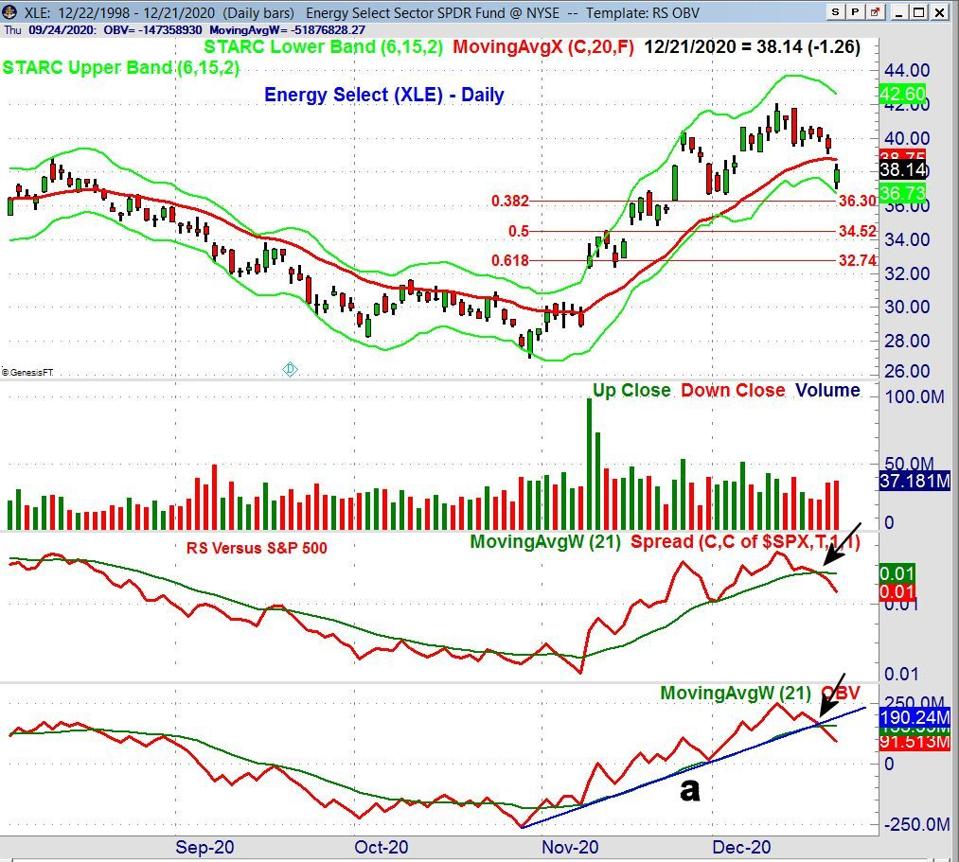
The Energy Select (XLE) XLE -0.5% is an ETF with 25 holdings. It has $13.2 billion in assets, an expense ratio of 0.13%, and a yield of 5.7%, according to Morningstar. XLE gapped lower on Monday, and as of Tuesday’s close is down 10.6% from the December 10 high at $42.08. Monday’s open below the 20-day EMA is not a positive technical development. The 38.2% Fibonacci support is at $36.30, which is close to the daily starc- band. The more important 50% support is at $34.52, which is just over 8% below Tuesday’s close.
XLE’s relative performance (RS) versus the S&P 500 dropped below its WMA on Thursday, December 17, warning of this week’s decline. On the same day, its OBV turned negative by violating both its support (line a) and its WMA. If XLE does rebound, it has resistance in the $40 area.
XOP
TOM ASPRAY – VIPERREPORT.COM
The SPDR S&P Oil & Gas Exploration (XOP) XOP -1.5% is an ETF with 44 holdings. It has $2.2 billion in assets, an expense ratio of just 0.35%, a yield of 2.6% and 44 holdings. This ETF is more diversified than XLE. For example, XOP has a 3.8% holding in Exxon Mobile XOM -0.4% (XOM), as compared to XLE’s 23.1% holding.
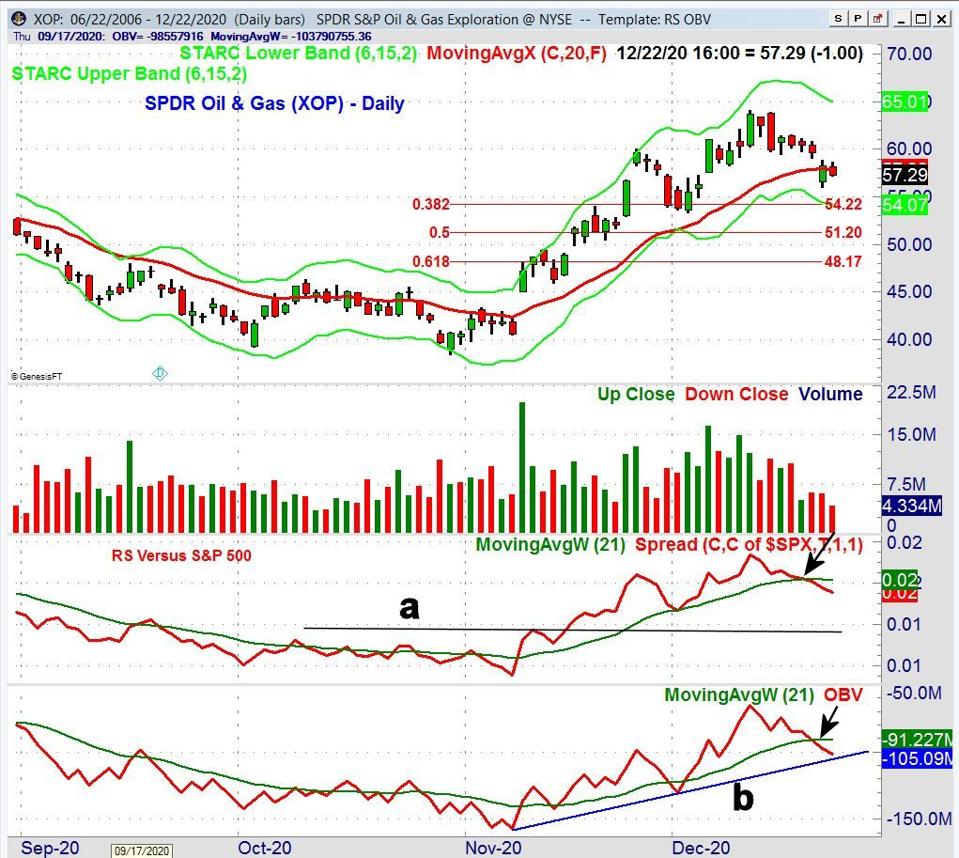
On December 10, XOP had a high of $64.09 and as of Tuesday’s close at $57.29, is already down 10.6% from the high. The 38.2% retracement support is at $54.22, with the 50% support level at $51.20. Based on Fibonacci analysis, a close below the 61.8% support at $48.17 would increase the odds that the rally from the March lows is finally over.
The daily RS for XOP versus the S&P 500 dropped below its WMA last Friday December 18, and is now negative. There is significant RS support at the November 10 high (line a). The OBV also turned negative on Friday and is now close to the support (line b). A drop below this support will mean XOP is then likely to decline even further.
During the last weeks of 2020 and early in 2021, the crude oil support at $43.54 will be the next level to watch. If crude oil closes below $41.73, then a test of the 2021 yearly pivot becomes more likely. If the lows in October 2020 were actually a significant bottom for XLE and XOP, then a correction is likely to bottom out between the 38.3% and 50% support levels. These are the areas I will be watching in the weeks ahead.
In the Viper ETF Report and Viper Hot Stocks Report, I teach subscribers how to pick stocks or ETFs, and provide specific buy and sell advice along with market commentary. Each report comes out twice a week and is only $34.95 per month.